Revenue & orders
Net revenue over any period with its trend, next to average order value, refund rate and realised orders.
Net revenue£9,646.00+6.4%Last 7 days
£516.00
The nightly restaurant brief
Turn restaurant sales, demand, menu, guest and booking data into clear metrics and a ranked set of AI-assisted findings.

AI Analytics
Your figures, with the changes worth noticing.
Evidence, then interpretation
Tapp calculates the metrics first, keeps the source figures visible, and uses AI to help operators focus attention.
Analytics
Last 7 days
Five connected domains
Each area answers a different question an owner asks, while orders and service keep the whole picture connected.
Net revenue over any period with its trend, next to average order value, refund rate and realised orders.
Net revenue£9,646.00+6.4%Last 7 days
Peak hours by revenue and orders, service speed, and every weekday against its baseline.
£640.0020:00 · 27 orders
Dishes and categories ranked by revenue or by transactions, with item velocity and menu engineering one step further.
Top sellerSalmon poke bowl£1,840.00
Repeat guests, no-shows and cancellations, next to fill rate, lead time and RevPASH.
8.1%
5 no-shows · 62 eligible
Questions, not dashboard theatre
The strongest insight shortens the path from a number to a sensible next question.
-14%Below baseline
Compare each weekday with its own baseline, and see which hours carry the revenue, before planning coverage.
Popular and profitable.6 items
Menu engineering sorts every item by popularity and margin into Stars, Plowhorses, Puzzles and Dogs. Until item costs are set, it works from revenue.
74.2%46 fulfilled · 62 slots
Put booking fill rate, no-shows, lead time and table turn time in the context of actual service.
Insight from the system running service
Analytics can say more when the order, guest, booking and table session live in the same restaurant system.
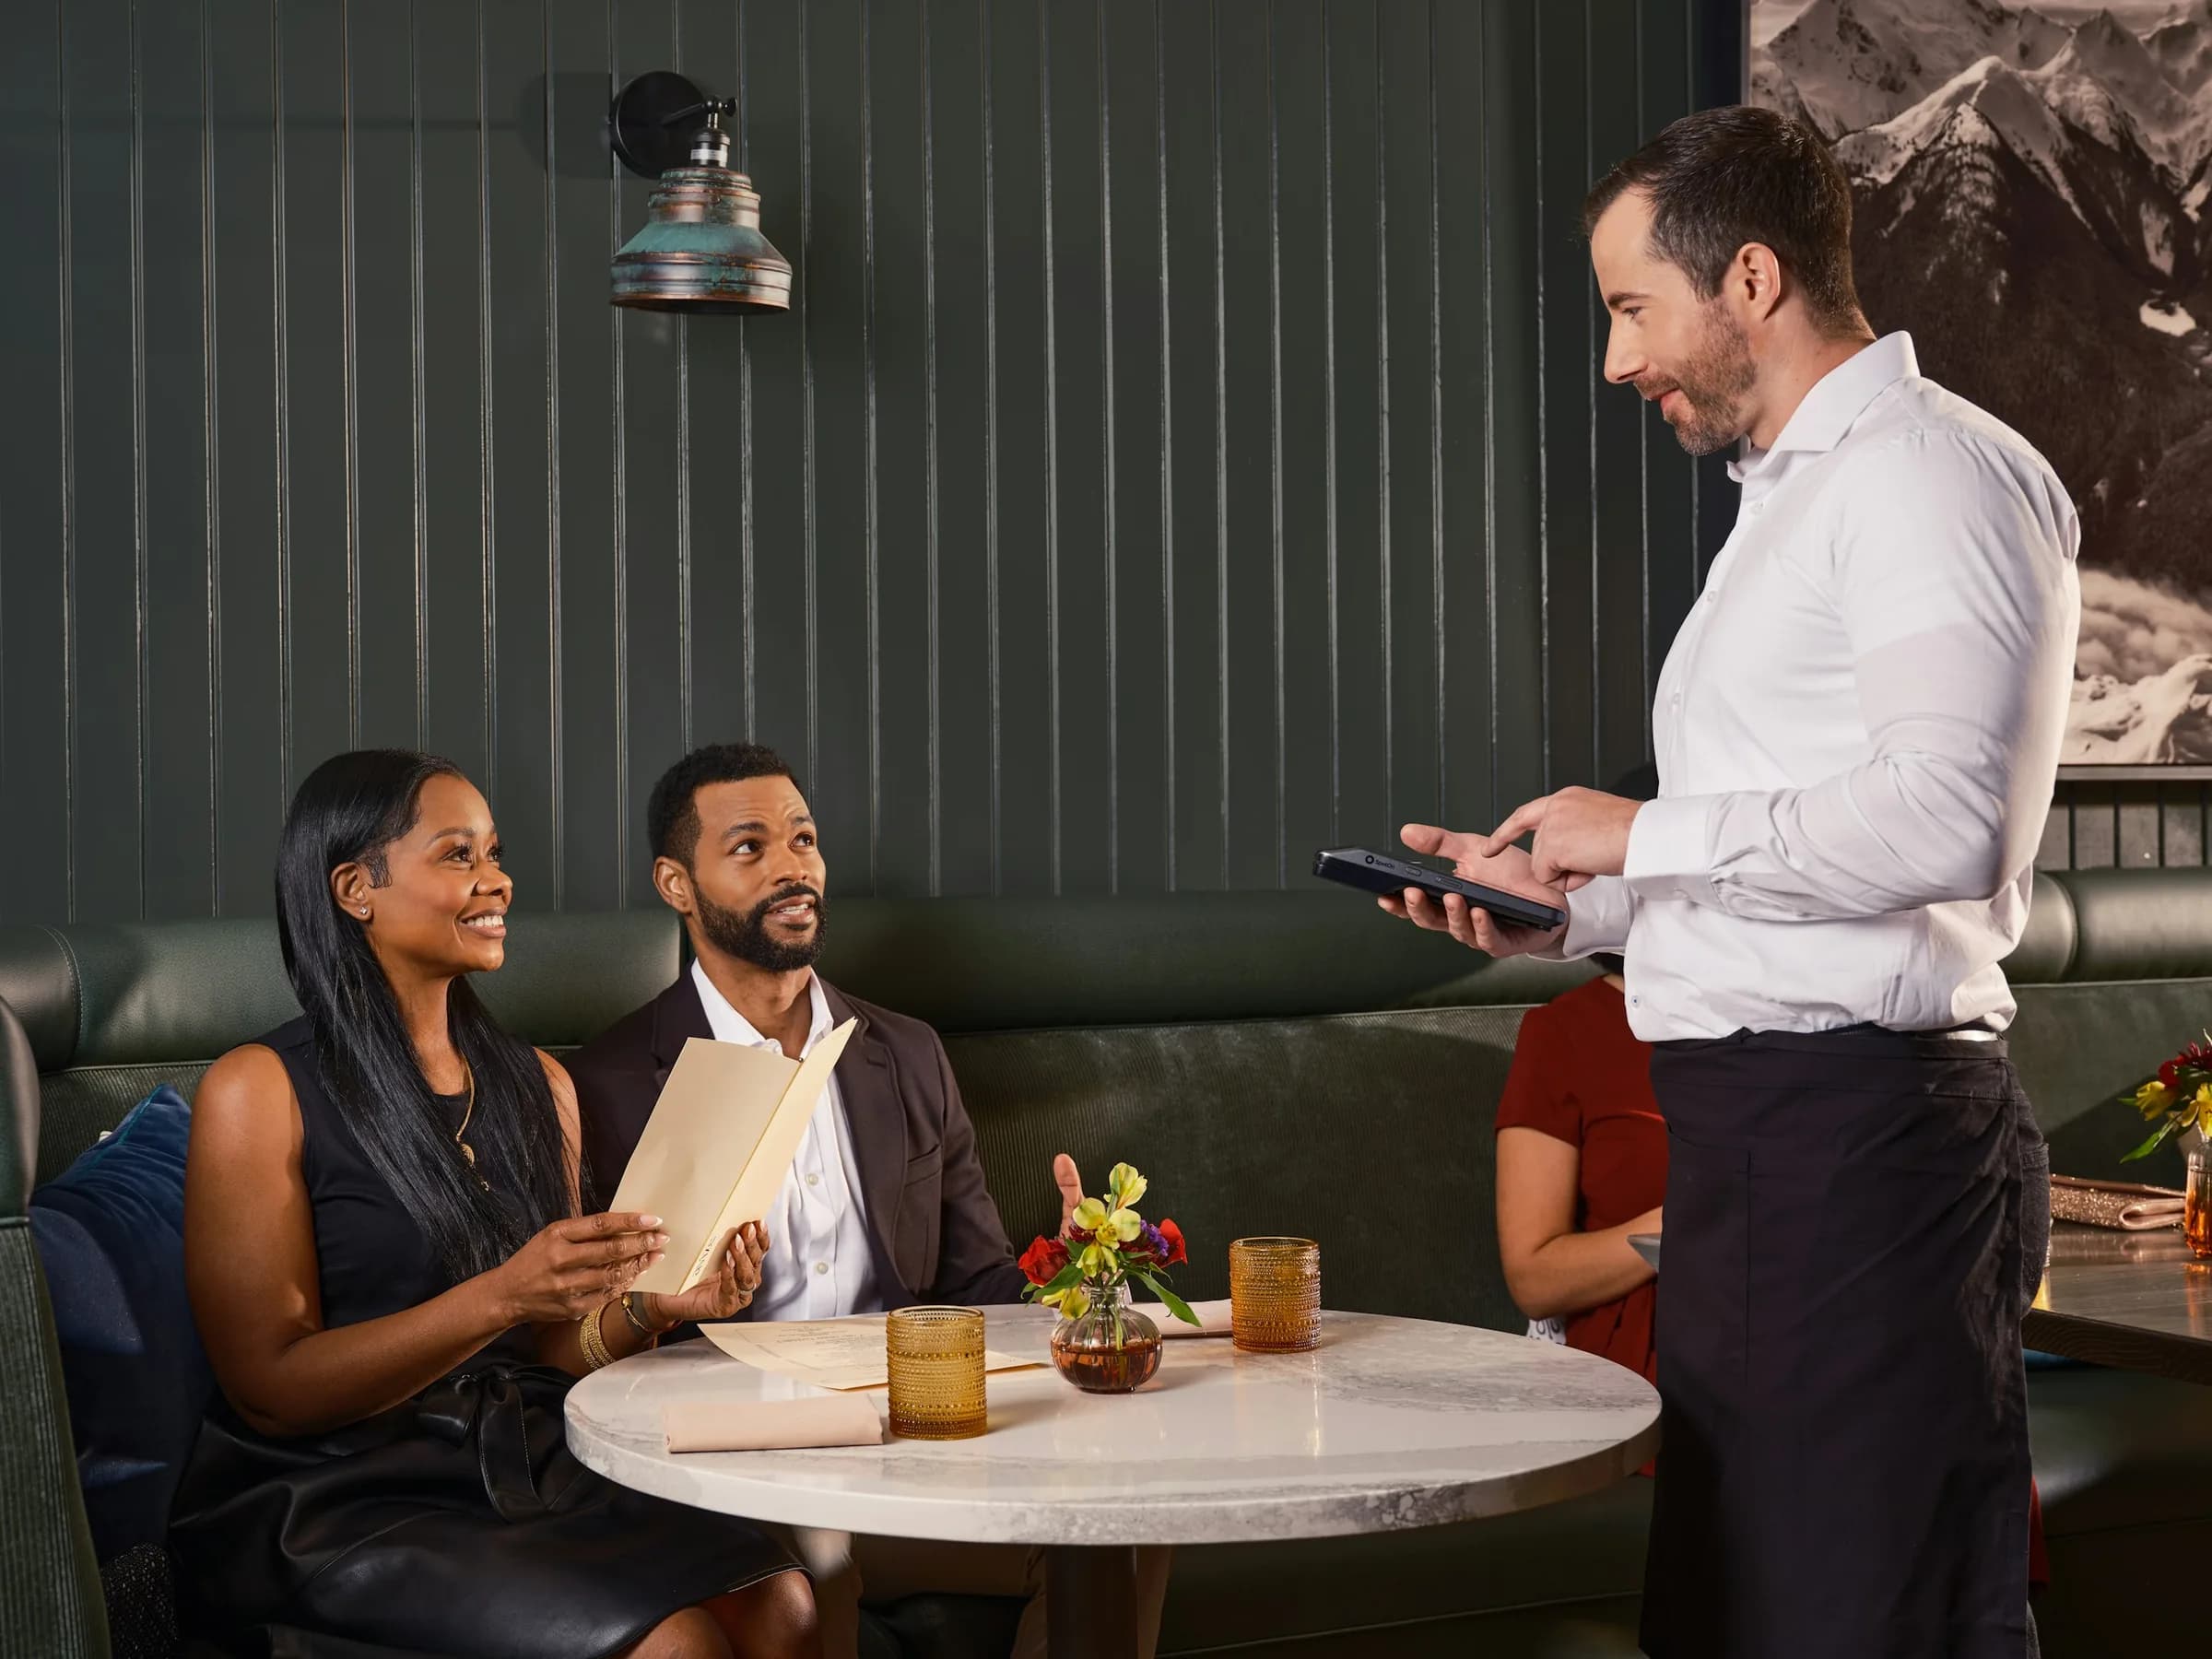
Every order and payment is the foundation of the revenue, order and menu metrics.
Explore Point of sale
Bookings and table sessions add fill rate, no-shows and table turn time.
Explore Rooms & Tables
Every promotion gets a nightly impact read: a measured effect, or simply normal variation.
Explore PromotionsAI answers from our Help Center. Please don’t include personal or payment details.
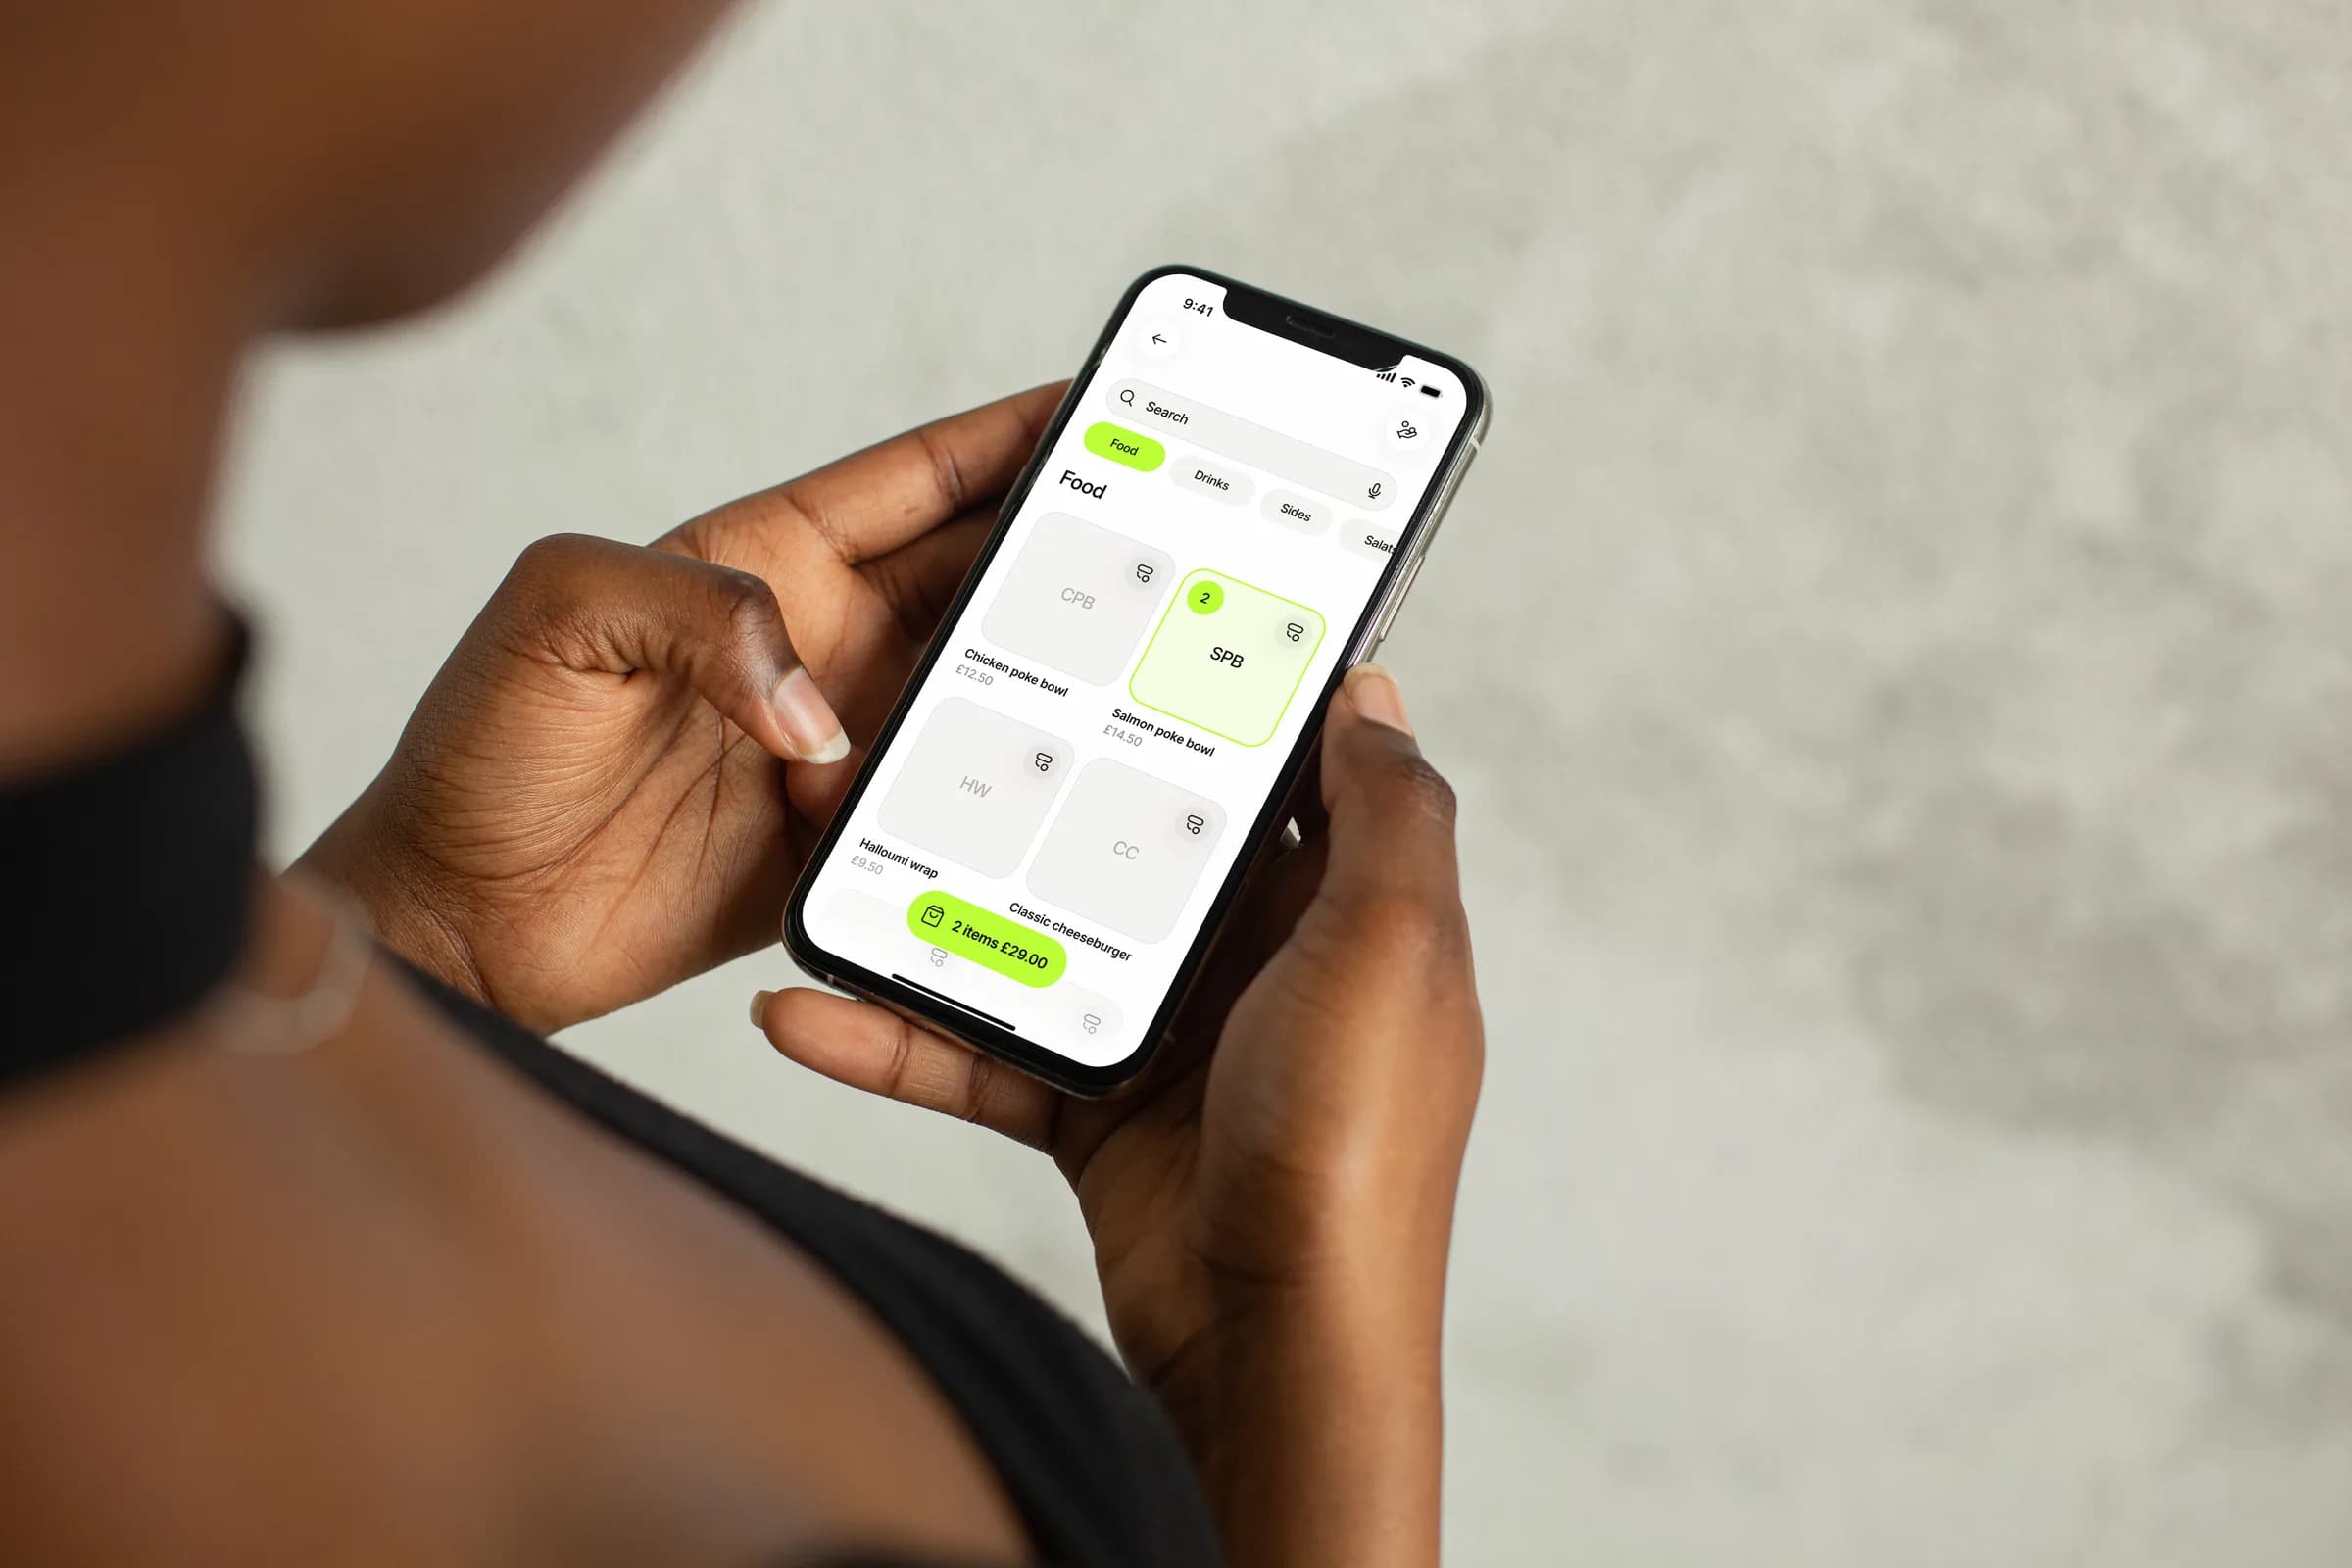
See which restaurant metrics and nightly insights are available for your Tapp setup.